Overview
IRIS is a desktop DICOM annotation tool that uses AI segmentation to speed up how radiologists mark and measure anomalies on medical scans. The project started when a radiology clinic network approached us with a straightforward frustration: their existing tools were slow, disconnected from their PACS systems, and forced clinicians to work against the software rather than with it. My role was to research how radiologists actually read scans, then design an interface that could introduce AI assistance without disrupting the trust and precision their work demands.
01 — The Problem
Radiologists reading brain MRIs follow a methodical process: load the study, scroll through slices across multiple planes, flag anything suspicious, annotate it, then compile findings into a structured report. In a typical session, a single radiologist might read 50+ studies.
The tools they were using added friction at every step. Switching between sagittal and axial views required navigating nested menus. Annotation toolbars cluttered the viewport. Labels had to be typed manually with no standardised vocabulary. And none of the AI segmentation tools on the market integrated into the reading workflow. They ran as separate applications, forcing clinicians to export, process, and re-import.
"I spend more time fighting the software than reading the scans. If a tool can't keep up with how I actually work, I won't use it, regardless of what it promises."
The result was predictable: slower turnaround, higher cognitive load, and clinicians ignoring the AI tools entirely because the context-switching cost outweighed the benefit.
02 — Discovery
I spent two weeks observing reading sessions at three clinic sites, shadowing radiologists as they worked through their daily case lists. The key insight wasn't about any single pain point. It was about flow. Radiologists develop a rhythm when reading scans, and every interruption (a slow-loading study, an unexpected dialog, a toolbar that covers the image) breaks that rhythm and forces them to mentally restart.
I mapped the end-to-end annotation workflow to identify where AI could add value without breaking flow. The critical moment was step 3: searching for anomalies. If AI segmentation could run automatically as slices loaded, highlighting regions of interest and pre-populating measurements, it would save the most time at the point where clinicians need it most.
From those sessions, I distilled the core requirements into eleven areas that any new tool would need to address:
Ability to share annotated images with colleagues.
Collaboration features for multiple users to work on the same images.
Integration with reporting tools for creating diagnostic reports.
Export options for sharing reports in various formats.
Display of patient information associated with the DICOM images.
Patient search and filtering options.
Ability to load DICOM images.
Efficient rendering and display of medical images. Multi-series support for handling various image sets.
Zoom functionality for detailed examination.
Pan controls for navigation within large images.
Clean and intuitive UI for easy navigation.
Customisable layout to accommodate user preferences. Multi-series support for handling various image sets.
History tracking for easy review and comparison of previous images.
Annotation tools for marking regions of interest.
Measurement tools for distance, angles and areas.
Ensure compliance with healthcare data privacy regulations.
Use authentication and access controls.
Logging and auditing features to track user actions for accountability.
Optimisation for different hardware configurations.
Compatibility with various operating systems and devices.
01
Patient Has Radiology Scan
02
Load Slices Into Annotation Software
03
Search For Anomalies On Slice
AI Process
AI Runs Segmentation, Adds Measurements & Highlights Segments
04
Add Labels
05
Repeat On New Slice / Conclude With Final Report
03 — Design Decisions
Three constraints shaped the interface from the start: TGA (Therapeutic Goods Administration) compliance for regulatory approval, DICOM standard compatibility, and the non-negotiable requirement that the tool feel native to how radiologists already work.
Dark theme as a clinical requirement
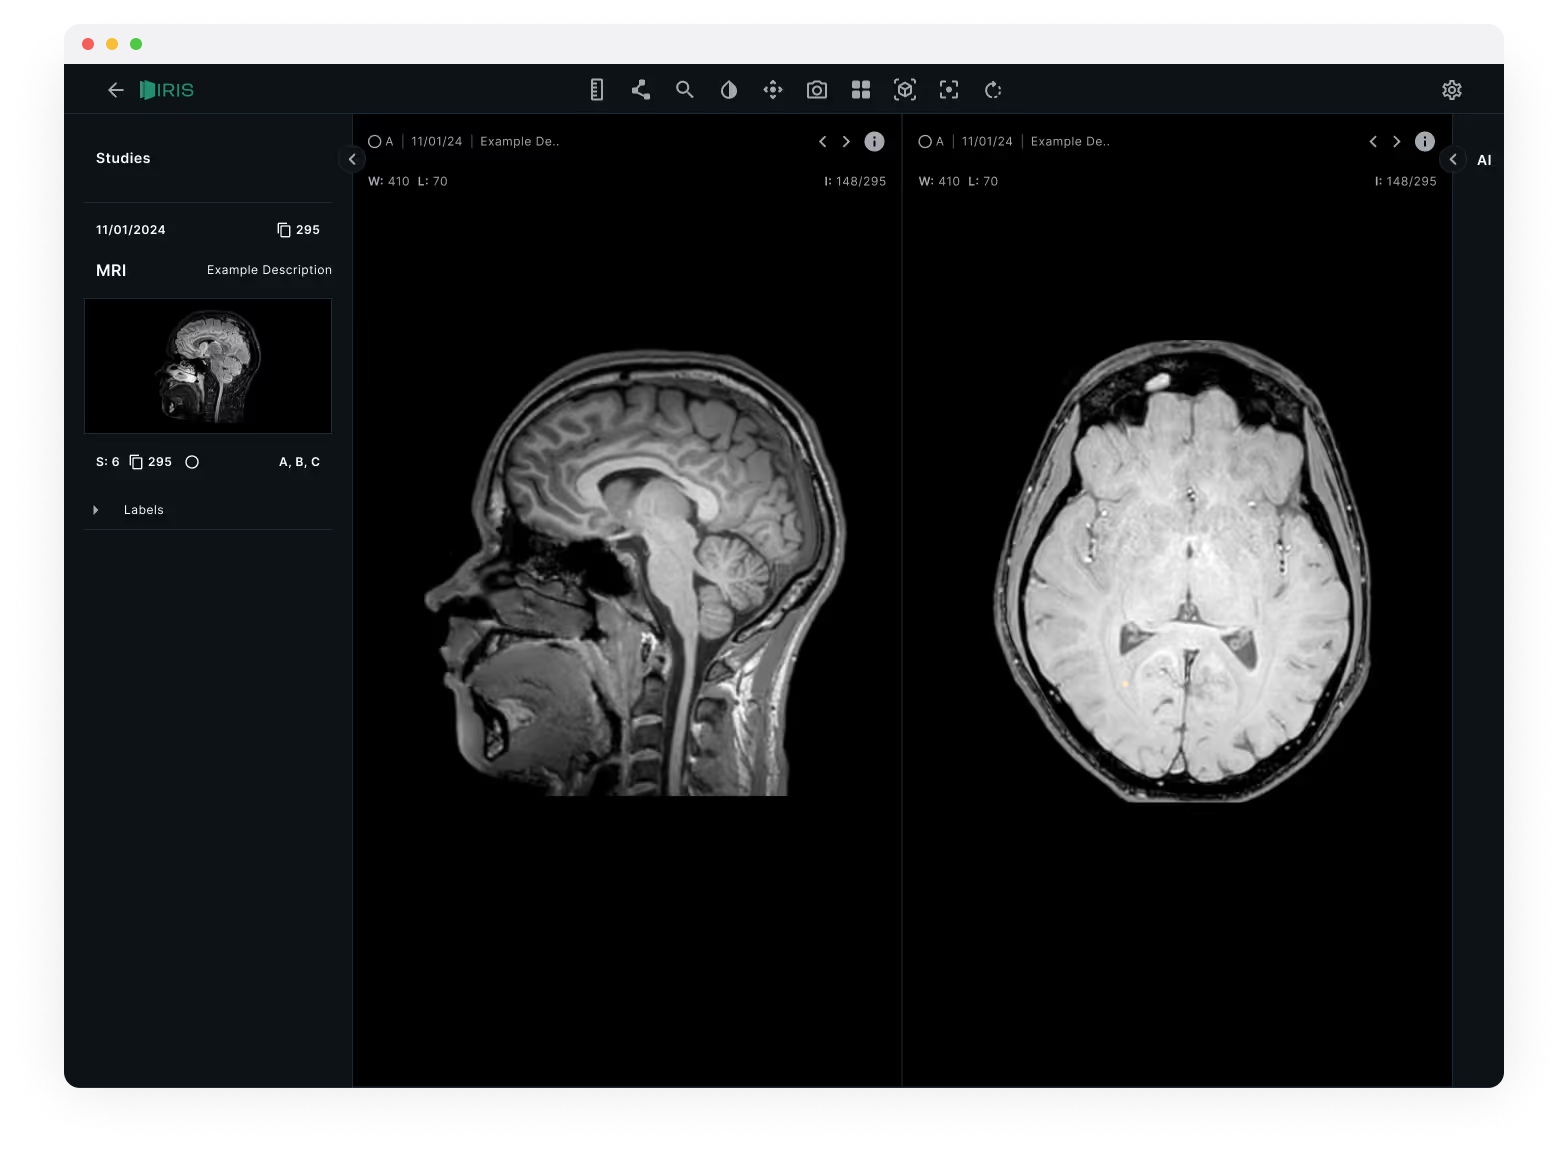
Radiologists read scans in dimmed rooms to improve contrast perception. A light interface would wash out subtle density differences in the images. The dark theme wasn't an aesthetic choice, it was a clinical one. I used a near-black background (#14191A) with high-contrast white text for metadata, keeping the UI chrome as invisible as possible so the scans themselves dominate the viewport.
Dual-view comparison layout
Brain MRIs are read across multiple planes: sagittal (side), axial (top-down), and coronal (front). Existing tools forced radiologists to toggle between these views one at a time. IRIS places two views side by side as the default, with synchronised scroll so moving through slices in one view updates the other. This mirrors how experienced radiologists cross-reference planes mentally, but removes the manual switching.
Studies sidebar with progressive disclosure
The left sidebar organises studies by date and scan type, with thumbnail previews showing orientation at a glance. Labels sit in a collapsible panel beneath, visible when you need them, tucked away when you don't. The goal was to keep the information hierarchy flat: patient context on the left, images in the centre, tools only when invoked.
04 — Prototyping & Testing
I built a high-fidelity prototype in ProtoPie that simulated the full annotation workflow, including the AI segmentation step. We tested it with six practising radiologists across two sites, running them through a standardised set of five brain MRI studies.
Four issues emerged from testing:
- AI confidence wasn't visible. Radiologists wanted to know how certain the AI was about each segmentation before deciding whether to accept it. We added a subtle confidence indicator (opacity-based highlighting) so low-confidence regions appeared as suggestions rather than assertions.
- The labels panel needed keyboard shortcuts. Typing labels broke reading flow. We mapped the most common anatomical labels to single-key shortcuts and added autocomplete for everything else.
- Toolbar placement was wrong. We initially placed annotation tools in a left rail. Radiologists expected them at the top, consistent with their PACS systems. We moved them to a horizontal toolbar above the viewport.
- Study switching was too slow. Loading a new study took 2-3 seconds in the prototype. We implemented progressive loading so the first slice appears immediately while the rest load in the background.
05 — Outcome
The final design was validated across all three partner clinic sites. The AI-assisted workflow reduced average annotation time per study while maintaining diagnostic accuracy, the key metric the clinic network needed to see before committing to investment. IRIS launched as an exclusive beta with the founding clinic partners, with a regulatory pathway for TGA approval already underway.
~40% Faster
Average annotation time per study with AI segmentation enabled
Investment Secured
Clinic network committed funding based on beta validation results
6 Beta Clinics
Exclusive beta launched with founding partner sites across the network
TGA Pathway
Regulatory submission for Therapeutic Goods Administration compliance